The honest energy ledger

Australia's energy transition, fully costed.

Solar and wind are cheap per megawatt-hour and growing — that part is real, and we'll say so plainly. But the true bill is being hidden: the dollars, the materials, the replacement cycles, and the supply-chain dependence the headline number leaves out. This is the part nobody counts.

A sister site to UNPREPARED· sourced & human-verified
What Australia has spent & committed on the renewable transition
A$173,000,000,000
and climbing ~A$25bn/yr · spent + committed gross capex (range A$150bnA$195bn)
A$62bncapex
Rooftop solar — household & business gross capex (~28 GW, since 2007)
ABS National Accounts (household-solar gross fixed capital formation)
A$34bncapex
Large-scale onshore wind capex (since 2000)
IRENA capacity × vintage cost; Clean Energy Council
A$30bncapex
Battery storage capex — household + grid-scale (since ~2015)
SunWiz, AEMO, project values
A$21bncapex
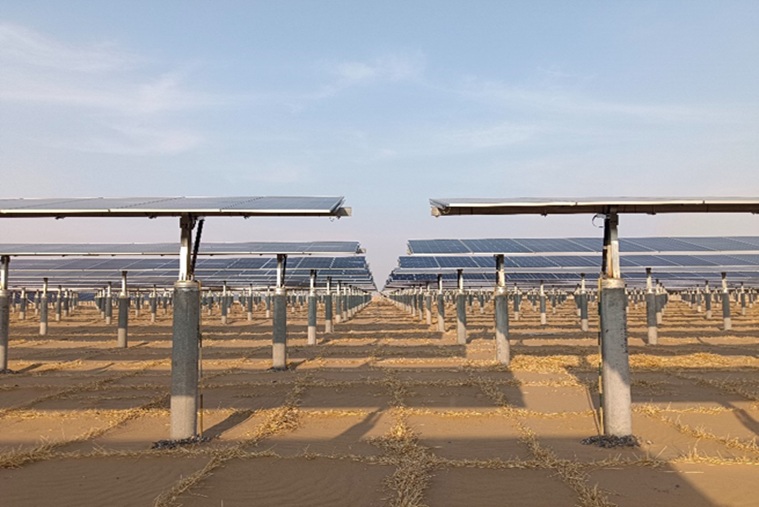
Utility-scale solar farm capex (13.4 GW, since 2015)
Clean Energy Council; capacity × vintage cost
A$26bntransmission
Transmission & firming — committed (Snowy 2.0, HumeLink, EnergyConnect, Marinus)
AEMO; TNSP project pages; Snowy Hydro
A$160bn
spent to date
A$173bn
+ committed (headline)
A$195bn
all-in (incl. projected)

Sourced by an 8-category research sweep (ABS National Accounts for rooftop, AEMO/TNSP for the grid, IRENA & Clean Energy Council for wind, solar & batteries). It counts physical assets built, gross of subsidy. To avoid double-counting, the ~A$45bn of build subsidy (STCs, LGCs, ARENA, state rebates) sits within the capex and is never added on top. And AEMO's grid plan adds A$122bn moreto 2050 that isn't counted here. Nominal dollars.

And it still hasn't bought cheap power: on top of the build, taxpayers spent another ~A$10bn (2023–25) just to shield households from the price shock. (In fairness: that relief offset the 2022 global gas/coal spike, not the renewable build directly — green-scheme costs are ~6% of a power bill and have fallen. We count it separately, not in the headline.)

24
/ 100
The Energy Realism Score
Australia's energy strategy, graded on cost · reliability · sovereignty · materials · waste · deliverability — everything the "cheapest power" headline leaves out.
See the board →

…and what it's made of

Raw materials mined, shipped & manufactured for the buildout
21,083,410 t
21.1 million tonnes and climbing — most of it processed or made in China
Concretebulk
15.0 Mt
0% Chinabulk local material — no China dependence
Wind & transmission-tower foundations. Dominant by mass.
Steelbulk
3.6 Mt
12% Chinalargely domestically producible — not a chokepoint
Wind towers, solar mounting/trackers, transmission. Largest mined-metal mass.
Glassbulk
860,000 t
85% Chinasolar glass bundled in the >80% China PV chain
Solar modules (~70% of panel mass). ~95% recyclable, rarely recycled in AU.
Aluminiumbulk
560,000 t
59% Chinarefining; AU a major bauxite/alumina producer
Solar frames & racking, transmission conductor.
Polymers / compositesbulk
530,000 t
78% Chinasolar EVA/backsheet; wind-blade composite more distributed
Panel encapsulant + wind blades. The biggest end-of-life problem — hard to recycle.
Coppercritical
330,000 t
44% Chinarefining (mining ~8%, distributed)
The one mineral in EVERY clean-energy tech. Cabling, batteries, transformers.
Silicon / polysiliconcritical
160,000 t
95% China~95% polysilicon, ~97% wafers — the most concentrated node of all
The solar absorber. Xinjiang ≈ 40% of global polysilicon — much of it tied to Uyghur forced-labour allegations (the basis of the US import ban, the UFLPA).
Graphitecritical
38,000 t
90% China>90% battery-grade processing; China export controls since 2023
Largest mineral by mass in a Li-ion cell (the anode).
Lithiumcritical
3,350 t
67% Chinarefining; AU mines the most spodumene but ~95% ships to China to refine
Grid batteries (LFP). Metal content of committed storage.
Rare earths (Nd, Dy)critical
1,260 t
90% China~90% separation/refining; ~85–94% magnet manufacture
Permanent-magnet wind turbines (much AU wind is magnet-free geared).
Silvercritical
800 t
80% Chinacell metallisation; silver mining itself distributed
Solar-cell contacts. PV is a major global silver end-use.

The chokehold is refining, not mining. The China chokehold is MIDSTREAM — refining and manufacturing, not ore in the ground. Australia mines lithium, silica and rare earths; the vulnerability is the refinery and the factory. These tonnes are not one-and-done: panels are re-procured ~every 25 yr, inverters ~15 yr, blades ~20 yr — and Australia landfills most end-of-life panels and nearly all blades, so replacement is fresh mining, not a closed loop. Grid storage is overwhelmingly LFP, so it is a lithium + graphite story — negligible nickel and cobalt, unlike EV batteries. We don't inflate those.

The honest baseline

Grid Mix
Coal share of global electricity
33%
Ember, Global Electricity Review 2026
Grid Mix
Low-carbon share of global electricity
43%
Ember, Global Electricity Review 2026 (World profile)
Reliability
Capacity factor — utility solar PV
24.4%
US EIA Electric Power Monthly (data through December 2025, released February 24, 2026), Table 6.07.B
Reliability
Capacity factor — nuclear
91%
US EIA — Energy Explained: U.S. nuclear industry (reflecting Electric Power Monthly Table 6.07.A capacity-factor data)

The trackers

Grid Mix Reality

live

Who actually generates with what — coal, gas, nuclear, wind, solar — and how much is firm vs variable, by country.

Open tracker →

The Real Cost

live

What the A$173bn and ~20 Mt of material could have bought instead: the nuclear counterfactual, the firming bill, lifecycle carbon and waste — both sides.

Open tracker →

The Simulator

live

Size a clean-energy build and compare the two ways to deliver it — cost, material, China-dependence, firmness, carbon and waste, live as you drag.

Open tracker →

The Nuclear Case

live

The dispatchable, materials-light, low-China, low-carbon, long-lived option Australia bans by law — while crewing AUKUS submarine reactors. Why the ban is incoherent.

Open tracker →

China's Footprint

live

The 80–95% midstream supply-chain chokehold — coal-made panels, refined-in-China minerals — the sovereignty cost, material by material.

Open tracker →

The Hidden Costs of LCOE

live

Why the cheap-per-MWh headline is the most misleading figure in energy policy: firming, transmission, overbuild, replacement, system strength.

Open tracker →

Why GenCost Gets Nuclear Wrong

live

The report used to call nuclear too dear — recalculated. Move the four assumptions CSIRO chose conservatively (discount rate, asset life, capacity factor, FOAK) and watch the answer move. Honest both ways.

Open tracker →

Materials & the Replacement Clock

live

Tonnes per TWh (the fair comparison) and the repowering wave — inverters ~15yr, batteries ~15yr, panels ~25–30yr — the mining that never stops.

Open tracker →

How to read this site

Yes — solar and wind are cheap per megawatt-hour. That number is also the most misleading figure in energy policy, because it leaves out the bill that actually lands: the firming, the transmission, the materials, the replacement cycles, and the handover of the entire supply chain to Beijing. We count what the headline doesn't — and every figure is sourced, so you can check it. That full cost is what Australia is unprepared for.

The numbers, as they move

A short, sourced brief when the figures shift — a transmission blow-out, a supply-chain move, a milestone. No spam, no hype, just the receipts.

Free every week on Substack. Unsubscribe anytime.

Every figure is sourced — see each citation, or the methodology on Method & Sources. Part of the UNPREPARED family.